


All of this data insight is something that we’ve never really been able to see before. Working with Canada Post has helped us understand the opportunities we have available to us.
– Raunie Ratcliffe
Owner/Operator, Dr. Green Lawn Care Services
Success stories
Discover how brands have grown sales by using data visualization to make smarter targeting decisions.

Dr. Green
The lawn services company used data visualization to refine its direct mail campaign, compounding market sales growth by up to 30%.
Read their story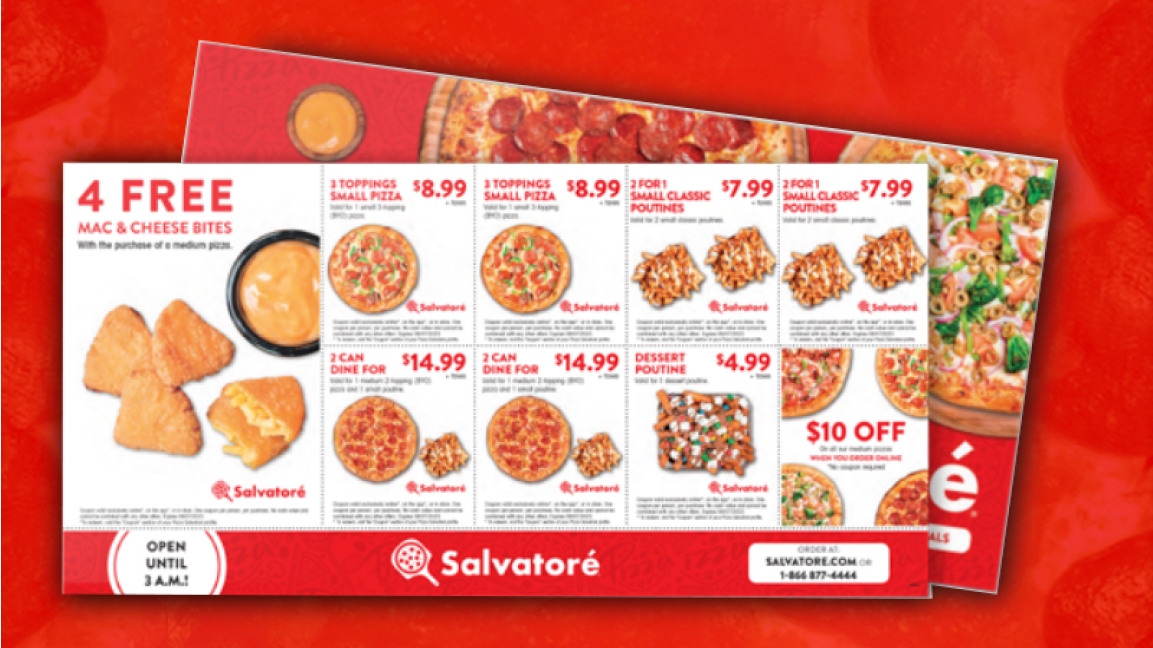
Pizza Salvatoré
The pizzeria used data visualization to identify and target under-exploited areas where customers were plenty and competition was weak.
Read their storyNew insights to reach new customers
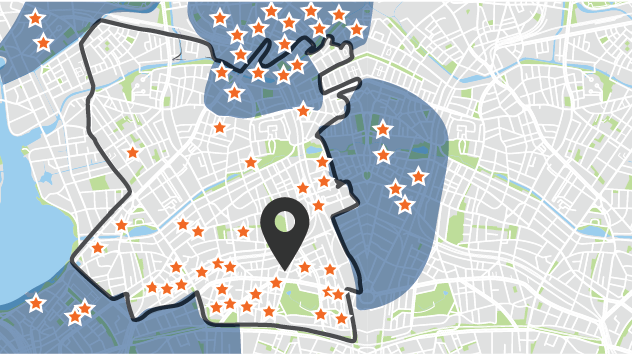
Custom interactive dashboard
Display and interact with multiple data layers to get insights on your customers and market.
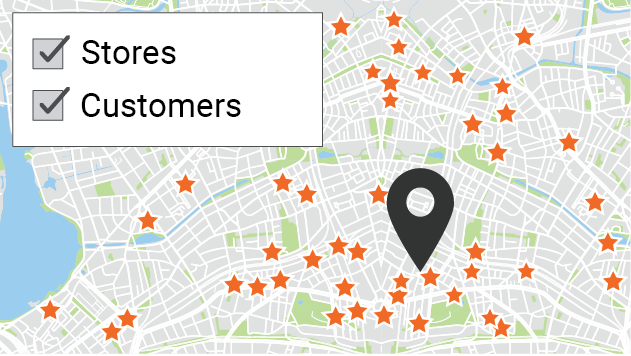
Data layers
Select data points such as store or competitor locations, combined with demographics and more.
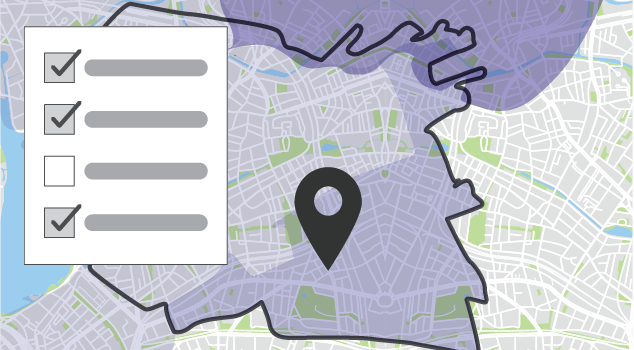
Target geography
View postal codes that best match your target audience and marketing objectives.
Campaign optimization
Analyze previous campaign results and use the insights to optimize your next campaign.
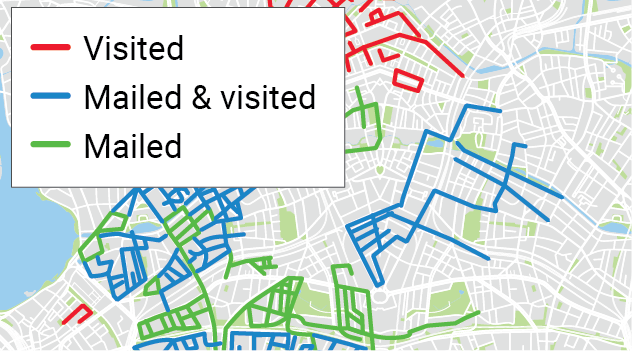
Confidence and clarity through data
Data is only valuable when turned into actionable insights. Visualization puts data on a map to help you see patterns and opportunities – insights you need to make informed, data-driven decisions.
Amplify your impact and drive results

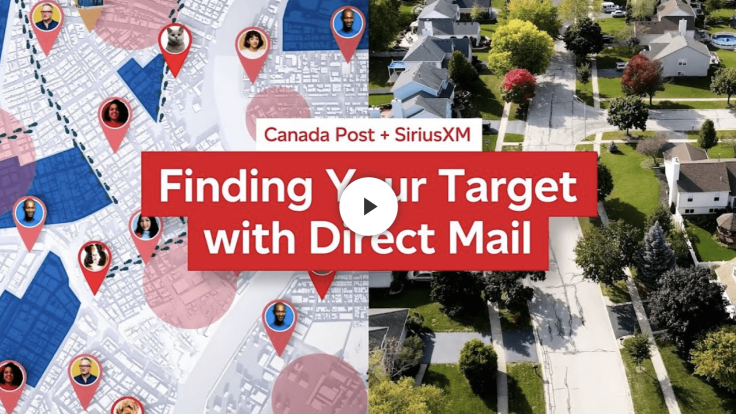
Uncover opportunities
Our webinar reveals how data visualization can be leveraged to make confident decisions. Learn how to take your marketing strategy to the next level with actionable insights.

Mapping your way
Data visualization and mapping tools structure data in ways that offer new relevance and perspective. Discover how to apply data insights in a meaningful way.
Big data, big understanding
Seeing is believing when it comes to data. Explore 5 ways data visualization reveals marketing possibilities and enables informed decision making.
Additional data solutions

License our data
Improve your mailing lists and run in-depth post-campaign analyses to better understand your audience and optimize targeting.

Rent our prospect lists
Acquire new customers by reaching residential and business addresses using postal codes and demographics attributes.

Clean your customer list
Ensure you have accurate addresses to increase response rates, reach more customers and reduce undeliverable mail costs.
Privacy and confidentiality
We're committed to complying with our obligations under the federal Privacy Act. Our name and address database starts with our postal code based address information and is expanded with information from publicly available telephone directories and consumer-based surveys. We also use statistical postal code level data provided by government departments and/or private-sector data aggregators. These sources do not give businesses any access to any personally identifiable information.
Visit our privacy centre to learn about our privacy policies.

Have more questions?
Not sure which data solution will drive the most success for your campaign? Send us a note and we can help you find the most effective approach.